Union Wages, Nonunion Wages, and Union Wage Gaps: 1973-2024
|
All Wage & Salary |
|
|
|
|
|
All |
||||
|
Construction |
||||
|
Manufacturing |
||||
|
Wholesale/Retail |
||||
|
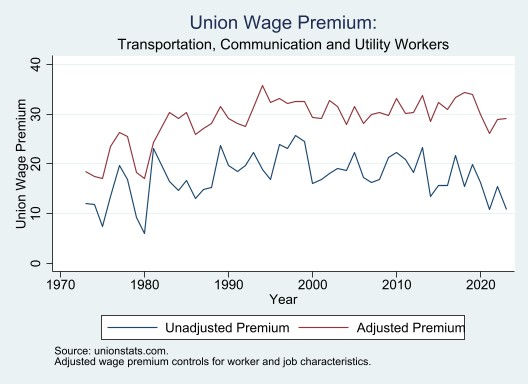
Trans/Comm/Utility |
||||
|
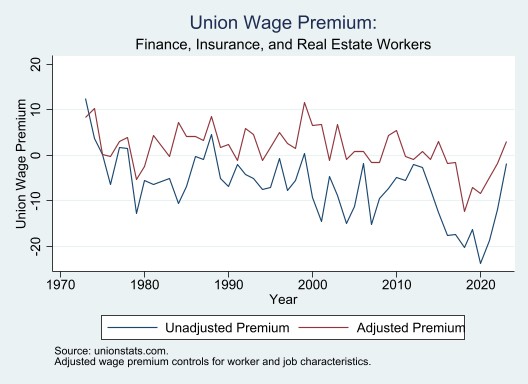
FIRE |
||||
|
Services |
||||
|
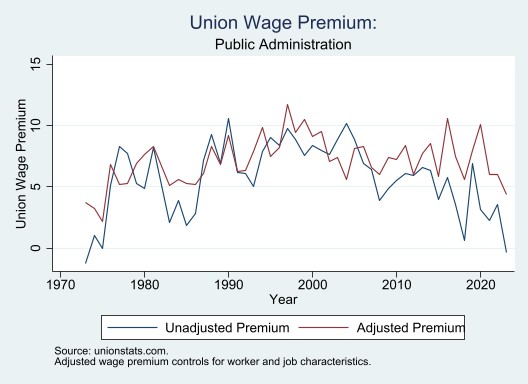
Public Administration |
||||
|
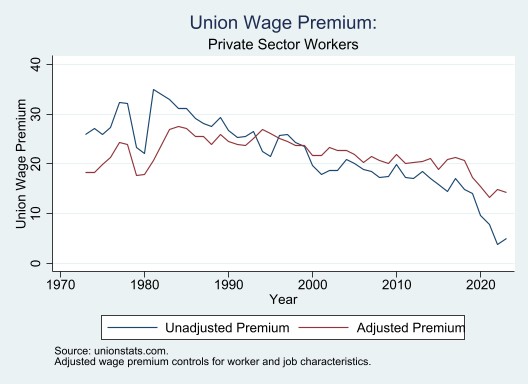
Private Sector Wage & Salary |
|
|
|
|
|
All |
||||
|
Nonagricultural |
||||
|
Construction |
||||
|
Manufacturing |
||||
|
Public Sector Wage & Salary |
|
|
|
|
|
All |
||||
|
Federal |
||||
|
State |
||||
|
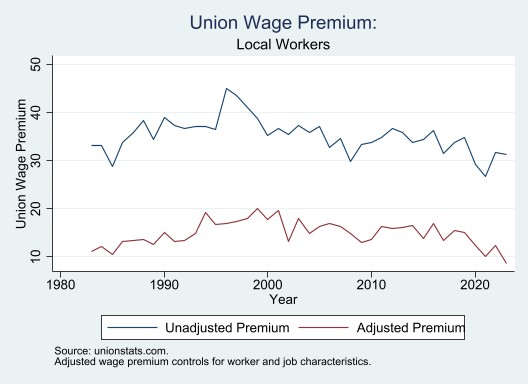
Local |
||||
|
Demographic Groups |
||||
|
Less Than Bacherlor's degree |
||||
|
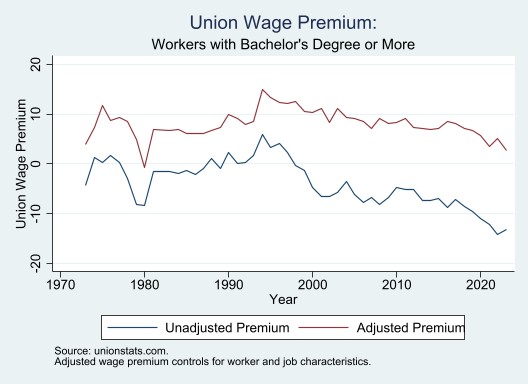
Bachelor's degree or more |
||||
|
Male |
||||
|
Female |
||||
|
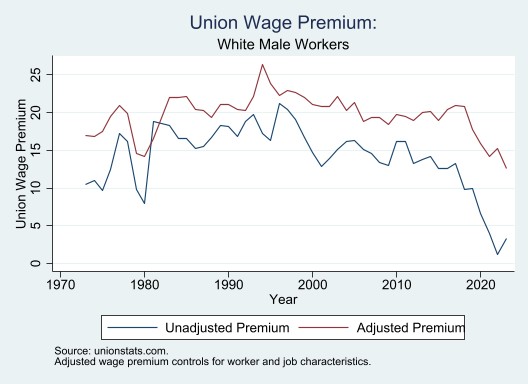
White Male |
||||
|
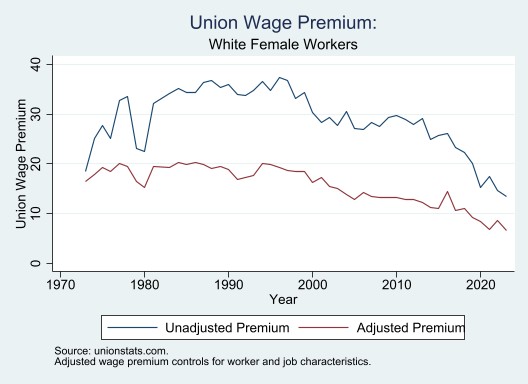
White Female |
||||
|
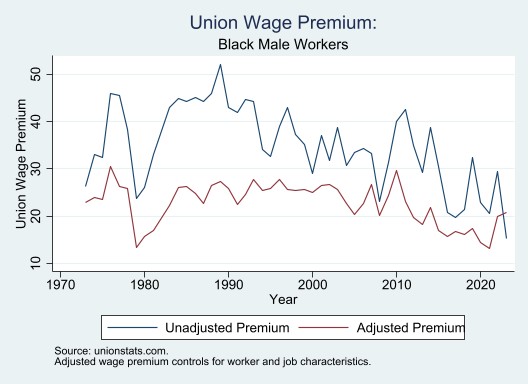
Black Male |
||||
|
Black Female |
||||
|
Hispanic Male |
||||
|
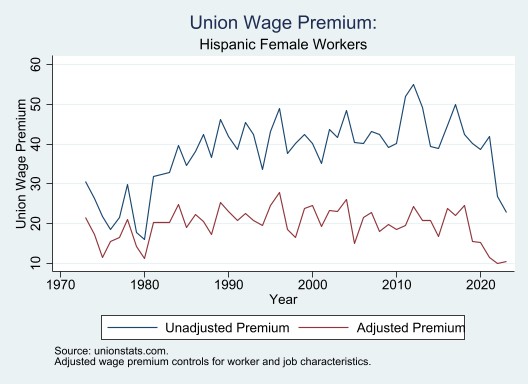
Hispanic Female |
||||
| DATA DESCRIPTION | ||||
|
Data
sources include the 1973-81 the May Current Population Survey (CPS)
and the 1983-2023 CPS Outgoing Rotation Group (ORG)
Earnings Files. There
were no union questions in the 1982 CPS. Sample includes wage and
salary workers, ages 16 and over, with non-missing earnings and
hours worked information.
Variable definitions are: Sample=CPS sample
size, Wage=mean hourly earnings in nominal
dollars, Union Wage=mean wage among
union members, Nonunion Wage=mean wage among
nonunion workers, %At
Cap=percent of workers with weekly earnings at the top code
of $999 through 1988, $1,923 in 1989-97, and $2,885 beginning in
1998, with individuals assigned mean earnings above the cap based on
annual estimates of the gender-specific Pareto distribution.
Beginning in 2023, the CPS assigns anyone with weekly earnings in
the top 3% a reported value equal to the mean of weekly earnings in
the top 3% from April through December for observations
with month in sample equal to 4. This is applied to
observations with month in sample equal to 8 beginning in April
2024. These observations are not
counted as topcoded. The $2,885 topcode is used for all other 2023
observations and are counted as topcoded,
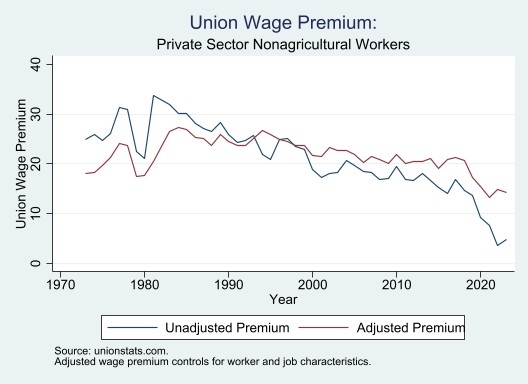
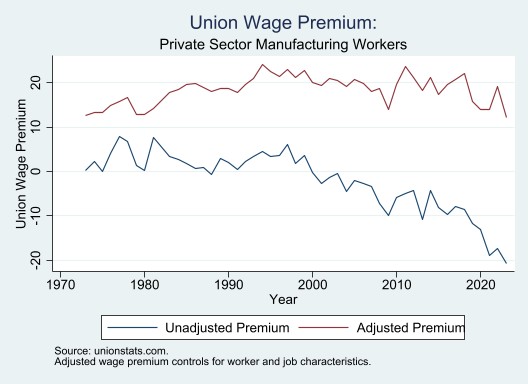
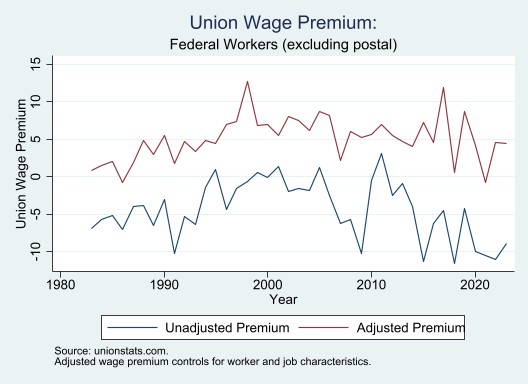
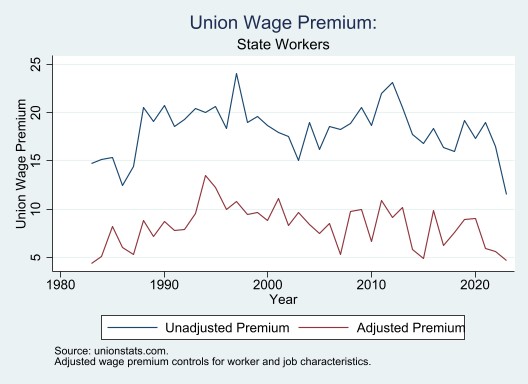
Unadjusted Union Wage Premium is the percentage
difference between the union and nonunion wage; the Adjusted
Union Wage Premium is estimated as exp(b)-1 where b is the
regression coefficient on a union membership variable (equal to 1 if
union and 0 otherwise) from a semi-logarithmic wage equation, with
controls included for worker/job characteristics. Included in
the all-worker wage equation are the control variables: years of
schooling, potential years of experience [proxied by age minus years
of schooling minus 6] and its square [both interacted with
gender], and categorical variables for marital status, race
and ethnicity, gender, part-time, large metropolitan area, state,
public sector, broad industry, and broad occupation. Controls
are omitted, as appropriate, for estimates within sectors or by
demographic group [i.e., by class, gender, race, or industry
sector]. Workers who do not report earnings but instead have
them imputed [i.e., assigned] by the Census are removed from the
estimation samples in all years, except 1994 and 1995 when imputed
earners cannot be identified. Inclusion of imputed earners
causes union wages to be understated, nonunion wages overstated, and
union-nonunion wage differences understated. For 1994-95, the
sample includes imputed earners and estimates in those years have
been adjusted to remove the bias from imputation.
|
||||